
Content provided by New Plymouth District Council
All good journeys begin with a map – especially when the journey covers a network of 692 kilometres of wastewater pipes.
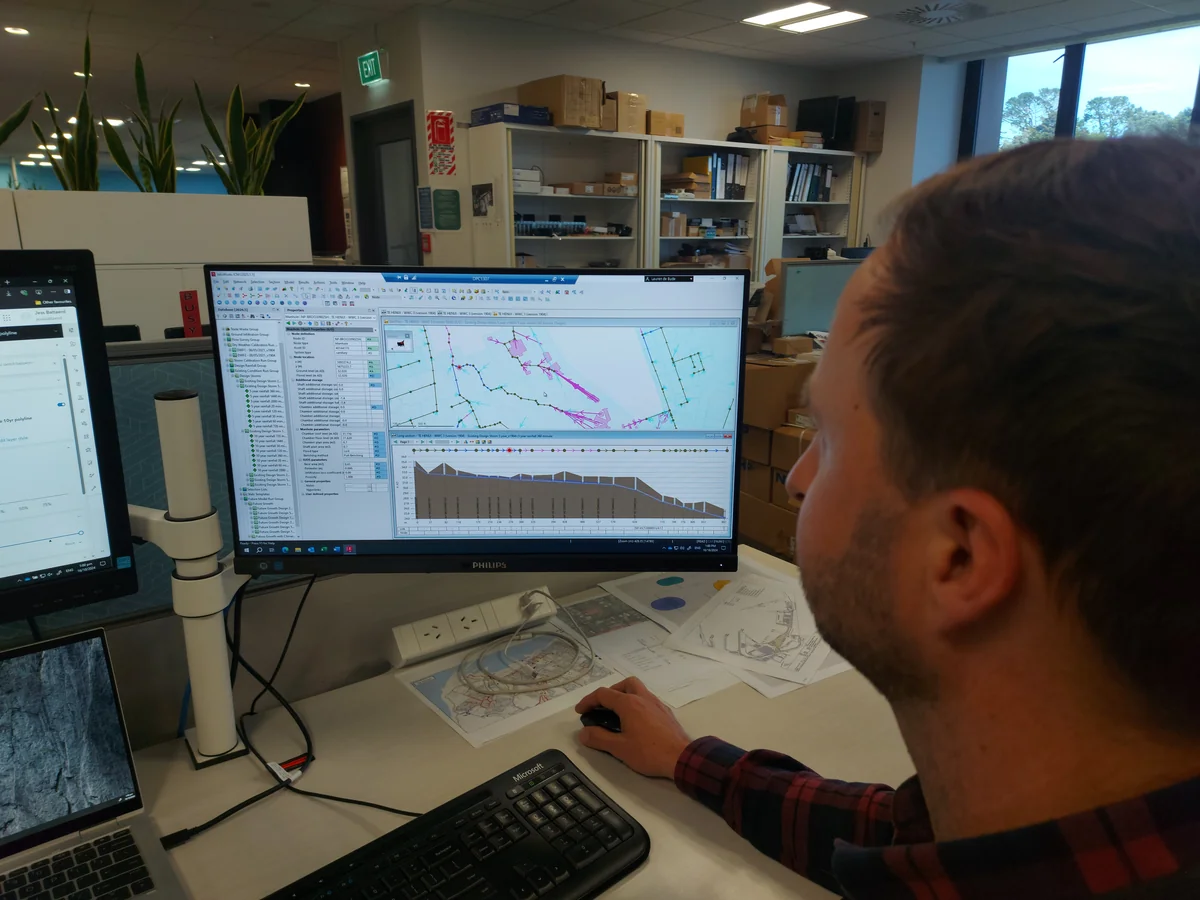
Last year, New Plymouth District Council (NPDC) completed a three-year project to map every pipe and pump station into a digital model, which is proving to be a powerful tool in helping it identify where the overflow risks are, the causes and how to solve them.
‘We’re about to start the first major wastewater improvement project that first had its designs tested in this digital environment – a 10-year, $13-million upgrade that will be a big step forward in fixing longstanding wastewater issues in Inglewood,’ says NPDC Manager, Three Waters, Amy Quattlebaum.
‘Being able to test the options first in the digital model means we’re confident that we’ll get the best outcomes for our investment in the town.’
The model can also be used for tweaking the district’s existing sewer network to gain more efficiency, and for planning for growth from both new and infill housing.
But for now, NPDC is focusing on priority areas, such as Inglewood. ‘It’s by far the best way to understand our wastewater network and plan upgrades.’
This type of digital tool is something that large councils around New Zealand have developed for themselves, and Quattlebaum says there’s value in smaller councils investing time and money into creating one, as well. ‘The model is really useful in helping you spend your budgets in the most effective way possible so that the community gets real value for money,’ she says.
Building the model
The first step in developing the model was to gather NPDC’s geographical information system (GIS) data about the network and identify where information gaps were, then send out surveyors to check those sites.
NPDC Senior Planning Engineer Jess Battaerd says they surveyed about 400 manholes across the district.
‘We then calibrated the model – put flow gauges in the network over two winters to measure the actual flows in the pipes – then put that into the model as real data: thousands and thousands of lines in spreadsheets to represent real life,’ says Battaerd. ‘The model gives us a holistic knowledge of the entire network.’
Where it gets really interesting is when proposed infrastructure improvements are mapped into the model and the team can see how it affects the network.
‘It’s like changing the phasing of traffic lights at one intersection: you might fix an issue there, but will it create a backlog of traffic at the next intersection?’ he says. ‘We can run scenarios and identify if this change could affect something further down the network that needs addressing.’
The network model, however, is only one part of the required planning for any project. For instance, it can be easy to connect two pipes in the model, but real-world testing is also necessary to identify any site-specific issues, such as the effect of ground conditions and nearby underground services.
Modelling in action
NPDC has already used the model on smaller projects. One involves developing emergency storage at a pump station in Bell Block, just north of New Plymouth. The pump station, which has a history of overflows, is next to a stream and very close to Bell Block Beach.
The team is using the model to test how much excess stormwater and groundwater runs through the pump station during various sizes of storm, to help identify the volume of emergency storage that is needed.
But by far the biggest project is focused on Inglewood – a town with more than 3500 residents located 15 minutes inland from New Plymouth. Inglewood has a long history of wastewater overflows in certain areas of town; during heavy rain, wastewater overflows have occurred on people’s property, and into creeks and streams.
In recent years, NPDC has taken ‘a good, hard look’ at the causes of the town’s wastewater overflows, including running a pilot study of 200 houses to help identify where the excess water in the sewage pipes is coming from, says Battaerd.
This root-cause analysis included distributed temperature sensing – where there’s a leak, the temperature in the pipe will change suddenly – as well as measuring flows and thorough camera inspections.
‘We’re hunting for where stormwater and groundwater is getting into the sewer pipes because if we can reduce that, we can reduce wastewater overflows,’ says Battaerd.
‘What we’ve confirmed is that Inglewood’s primary issues aren’t illegal connections from house gutters or low gully traps, but from cracks and defects in the sewer pipes due to their age, the town’s soil conditions and its high water table.’
By using the digital wastewater model, the team ran scenarios to see if installing a larger pipe or adding a new connection would cause an issue elsewhere in the network.
As a result, the team is confident that the $13-million wastewater infrastructure upgrade is going into the right places for the most effective solutions for the town.
What comes next
NPDC has been using all the information captured through the digital model to prioritise other areas in the district for a root-cause analysis.
The model is also helping with smaller, ongoing changes to improve operations, which could include seeing where less power can be used, if existing storage can be used better, or if altering a pump station’s operations would benefit or harm the wider network.
‘The best part is that the wastewater model enables us to be proactive rather than reactive,’ says Quattlebaum.
‘We’re not only responding to overflows or complaints; we’re working on getting ahead of the big issues, and putting in long-term fixes and efficiencies before problems occur.’ 
Did you know?
- NPDC is investing $289 million over 10 years up to 2034 to fix the district’s plumbing.
- NPDC collects and treats sewage from the urban areas of New Plymouth, Bell Block, Waitara, Inglewood and Ōākura, and returns clean water to the environment via the New Plymouth Wastewater Treatment Plant.
- On average, NPDC handles 25 million litres of wastewater each day, looking after more than 27,000 properties in the district.
